Motivation
The definition of extreme drought is much more complex than first appears, because a critical issue in the study of drought, unlike heatwave or heavy precipitation, is the multiscalar nature. Specifically, the multiscalar nature of drought refers to that the response of usable water resources, including soil moisture, ground water, snowpack, river discharges, and reservoir storages to water shortage varies markedly and with different time scales. As such, it is common to find extreme drought conditions recorded in one system (e.g., low river flows), whereas other systems in the same region (e.g., crops) have normal or even humid conditions. This makes it hard to define extreme drought event, since different water resources component can be heterogeneous within a region.
See the below illustration:

Concept
We have known the fact that the phases and frequencies of dry/wet oscillations at different time scales all differ; at times they are opposite and at other times they coincide. It is conceivable that a devastating event appears when extreme phases of short- and long-term droughts coincide. Therefore, the concept of super drought is referred to the simultaneous occurrence of extreme droughts at multiple time scales. In physical sense, super drought can be regarded as compound water deficits in all parts of usable water resources, which is expected to reinforce the damage that would result from a single-time-scale event.
See the below schematic diagram:

Case Demo
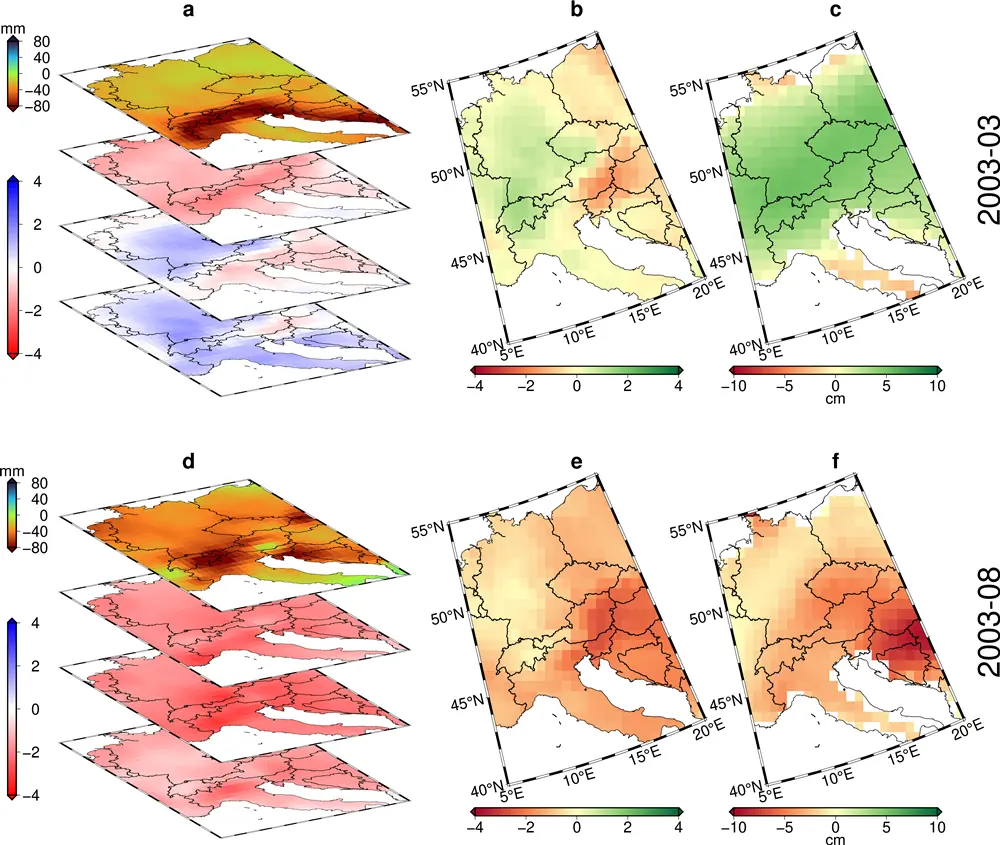
The case shown here is the devastating drought in central Europe during late summer of 2003. The below figure compares the drought status between March 2003 and August 2003. The precipitation deficits in both cases have overall similar intensities and cover broad portions of the domain. However, these two cases are essentially different, as high-impact drought is only recorded in Aug 2003. Hence, what makes the intrinsic difference between high-impact droughts and those causing mild damage? In March 2003, although precipitation deficit was substantial and short-term drought has fallen in severe category, there is no medium to long time scale droughts, because March 2003 was preceded by generous precipitation, which plays a key role in suppresing hydrological drought. Depending on super drought concept and CMI index developed, it is an absence of concurrent extremes at multiple time scales that leads to relatively moderate stress in March 2003. Meanwhile, it is not surprised to find CMI characterized by overall normal to wet condition, which agrees well with the observed positive water thickness measured by GRACE. In contrast, when turn to the case in Aug 2003, it can be seen extreme droughts at multiple time scales coincided, which is expected to yield more severe damage and widespread disruption to human society than events occurring in isolation. This is responsible for the substantial deficit of total water storage. Perfectly consistent with GRACE TWS observations, CMI has good capability to reproduce the drought pattern
The case illuminates that the essential feature behind devastating drought is not that precipitation is deficient, soil moisture is drying out or lake/reservoir water level is depleted, but a combination of multiple drought extremes or equivalently grand loss in total water storage. It also highlights the necessity and physical significance of super drought concept, which is useful to improve the understanding of overall drought extremity. Meanwhile, the proposed CMI performs well to monitor super drought event.